Copyright © Charlie Graham COBC
Design by Dzignine
Showing posts with label kat. Show all posts
Thursday, 27 November 2014

Election Connection


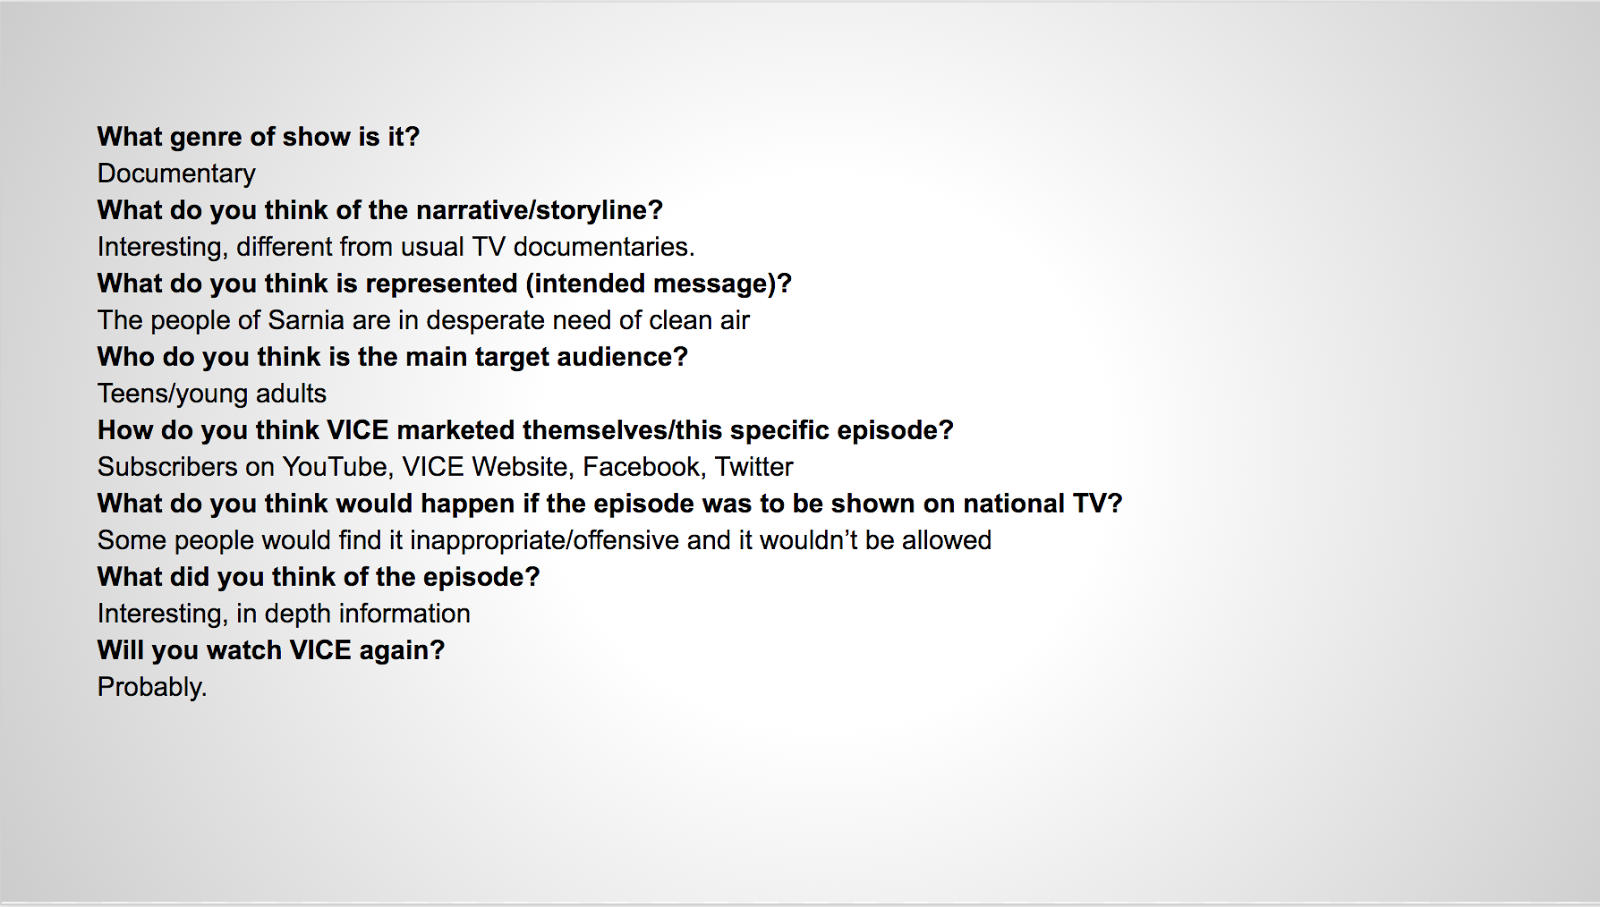
Research is the gathering of information needed for a product/type of media. There are many different types of research, all used for gathering different types of information.


  • Secondary Research
    • Research already compiled and organised for you.
  • Primary Research
    • New research carried out to answer a certain question.
  • Audience Research
    • Information about the audiences lifestyle & economy
  • Market Research
    • Research to gather information about target markets
  • Production Research
    • Research to determine what you will need to release the product at end of production


Examples of these are:
  • Secondary Research
    • Books, Internet, Magazines, Previous polls/questionnaires
      • These methods make it easier and faster to gather information, however sometimes cannot be reliable.
  • Primary Research
    • Questionnaires carried out yourself
      • Slower gathering of information, more reliable than secondary research, however questionnaires can sometimes be unreliable (due to people not answering honestly)
  • Audience Research
    • Questionnaires asking people about their lifestyle and economy
      • Useful information about target audiences lifestyle, however shares the same cons as primary research.
  • Market Research
    • Looking at competing products in the market
      • Useful if product is not unique, if product is too similar to others could lead to copyright issues.
  • Production Research
    • Certification, copyrighting,recce’s, risk assessment
      • Needed to legalise product/type of media, can take time but is compulsory.


All of these different types of research have different uses, these are some of the main ones:
  • Secondary Research
    • Find out information to reach target market/audience
  • Primary Research
    • Find out information to reach target market/audience
  • Audience Research
    • To find out about target audience to base product on their needs
  • Market Research
    • To find out information about competing products to compete against them and meet audiences wants/needs
  • Production Research
    • To release product legally and safely. To create a satisfactory product for the market


Media/product producers need to carry out this research in order to reach a target market more easily, to compete against competition and to make money.


Thursday, 13 November 2014

Genre Research


VICE


Pink Analysis

Identify four of the characters that are represented throughout.
How are the representations constructed?
What are these connotations being used?
What statement is the video making?


  1. Little girl
  2. Rapper girl
  3. Gym girl
  4. Driving girl

  1. Stereotypical girl with ponytails. Watching tv and being influenced by what she sees. Realisation at end of clip and returns to stereotypical girl with her toys after watching tv. Same camera shot throughout in a sitting room. Angel and devil on shoulder situation.


  1. Girl with rapper dressed in short skirt etc. Stereotypical for rap music video. Urban background with low angle shot.


  1. Running machine girl in sports outfit. Watching other woman in gym and feeling self-conscious. Comparing herself to woman. Set in gym background. Range of shots and angles. Depth of field used to highlight the expression on pinks face.


  1. Girl driving whilst on phone. Bags of shopping next to her. Stereotypical rich american teen. No care for others around her. A close up of her face and a mid shot showing some of the car are used. Designer outfit with coffee in hand and phone in other.


I feel that these connotations are being used to portray “stupid girls”. Slight element of comedy as all characters are obviously a mick take. I feel that the video is trying to make a statement about how stupid some people are. Pink wants to be a role model and doesnt want people to think that she is one of the “stupid girls”.
Wednesday, 12 November 2014

Political Poster Analysis

Purpose -  links equal rights movement (which was happening at the time) to the political party in order to promote themselves and reach the female demographic
Aims - to get women to vote for the specific party in order to gain equal rights.
Techniques -
Image - Pop art style, popular at the time. Portrays women as being strong. Links well to trends at the time.
Colour Scheme - Bold colours to catch the audiences eyes , Simple solid colours excluding image.
Copy - Simple catch phrase at the top of page. First thing to be read. Small print at bottom with logo of ‘committee’
Fonts - Simple san serif fonts used for clear, easy to read text. Professional looking.
Tone - Strong tone, “We can do it!”.


Purpose - To “mudsling” labour. Portrays that labour are leaving people unemployed. “Labour” could also be used in a different context and the poster still makes sense.
Aims - To convince people to vote for the conservatives and not labour.
Techniques - Simple catch phrase to catch the eye and make the poster memorable. “Britain’s better off with the conservatives” shows that this is a deliberate mudslinging.
Image - People queuing in a line for the unemployment office .
Colour scheme - Dark, dull colours to get information across in a professional manor.
Fonts - San serif font all in caps. (common in political posters) to portray information clearly and quickly and make it more memorable.
Tone - Strong tone, “Labour isn’t working.”


Purpose - To mudsling the labour party.
Aims - To stop people voting for labour and to encourage them to vote for other parties.
Techniques - Simple catch phrase to make memorable.
Image - Simple image of labour representative, obviously altered to portray that he is “evil”
Colour Scheme - Black and white image and background with bold red writing to stand out and make it more memorable.
Font - San serif font all in caps again. Both lines starting with new. This creates a memorable phrase
Tone - Strong tone, “new labour, new danger”


Monday, 3 November 2014

Questionnaire Evaluation

We asked a demographic of 52 people aged 15-25 some questions about politics. One of the questions we asked was whether they preferred Digital or Print posters. 42.3% of people said Digital and Print, whilst 13.4% of people said both and 1 person (2%) said none. We also asked the same people how much they know about politics (between 1-5). The average answer was 2.06. 44 of the 52 people we asked said they did not support a political party (84.6%). 3 of them said labour (6%), 1 said conservative (2%), 1 said green (2%) and 2 said they supported a party (4%), but did not state a specific one. We also asked them how often they access political information. 9 people said weekly (17.3%), 14 people said daily (26.9%), 6 said rarely (11.5%), 21 said never (40.4%).


When it comes to political posters, according to our questionnaire, people are evenly divided between Digital and Print posters. This shows a huge rise in digital advertising since being introduced. Unsurprisingly, considering the demographic chosen, the average political knowledge score was 2.06 out of 5. This result is extremely low, however due to the lack of compulsory political education this is not surprising. It is also unsurprising that the majority of people we asked don’t support a political party for the same reasoning. This result could also be linked to the age of the people asked (majority not old enough to vote). The majority of people also said they never access political information, again almost certainly related to the demographic.

Spreadsheet


In todays lesson I learnt how not to assume things when writing a factual evaluation of results. I also learnt how to professionally make assumptions using the results. I also re-learnt how to calculate percentages, averages and how to analyse/use filters in Google spreadsheet documents. I have previously used spreadsheets, however before coming to college I have never used Google's online 'Sheets". I found that my previous knowledge of spreadsheets transferred easily over to the new UI and I easily gathered the results and organised them effectively.